report September 2014…
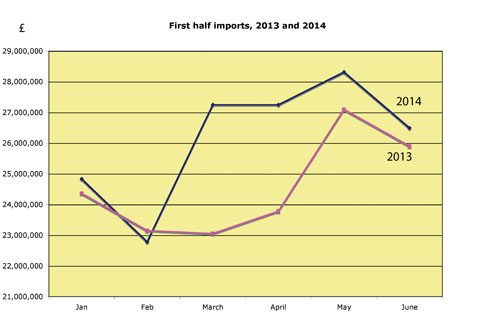
Imports of stone in the second quarter of 2014 continued to increase. They were up 10% on the first quarter of the year and 7% on the same quarter last year, according to figures from HM Revenue & Customs. For the first half of the year as a whole, imports were up 6% on the first half of 2013.
The figures exclude slate, imports of which fell slightly – down 6% on the first quarter and 3% on the second quarter of 2013.
The figures are compiled from VAT returns, so continue to be amended for many months, although early trends are usually reinforced over time.
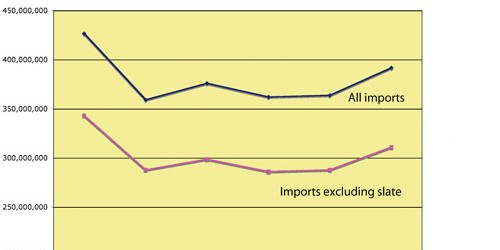
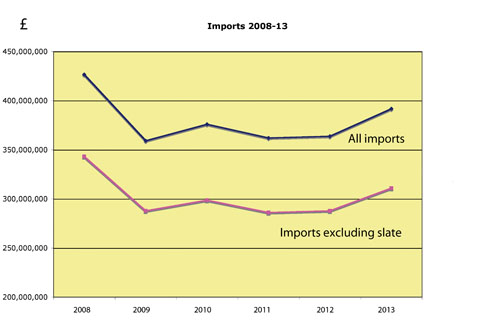
They also underestimate the market to some extent as some stone products are classified under other product codes. Nevertheless, they are compiled in the same way each period and identify trends. The current trend is clearly upwards, as the graphs here show.
There are no figures produced for British stone production, which probably now accounts for no more than a quarter of the market. However, according to the major operators of British quarries and mines, the trend is also upwards for indigenous stone sales.
Walling stone sales, which are predominantly British stone, had been badly hit by the drop in housebuilding, but some of the quarries that produce walling stone have reported that, while volumes are down, value has been supported by more masonry and architectural stone being used for larger houses and mansions. Because stone production in the UK is relatively small scale, it does not take many mansions to keep quarries and masons’ workshops busy.
The graph here showing annual stone imports since the height of the market in April 2008 identifies a classic ‘dead cat’ bounce in 2010. The fall in imports in 2009 was worsened by the withdrawal of funding arrangements to many companies by banks, which considerably worsened the impact of the banking crisis on the rest of the economy.
It is estimated that about 300 stone companies in the UK were forced out of business – around 7.5% of the industry – many of them in the kitchen worktop market, a sector that was hit by the general fall in incomes and consumer confidence and the crash of housebuilding.
For some, it was only a temporary absence from the market. Others have not returned. Those who remained had to reduce the level of stock held to bring it more in line with the lower level of demand. The effect was to reduce the import of stone below the general level of demand and produce the dead cat bounce in 2010 and the return to recession in 2011 as the market sought equilibrium.
Since then, many parts of the stone market have continued to reflect the improvement in the UK economy in general (the International Monetary Fund says the UK will easily have the highest level of growth in the developed world this year) as the increasing amount of stone being imported indicates.
Most of the stone arriving in the UK still comes from India, China and Italy, if you exclude slate. Slate accounts for much more than half the stone imports from Europe and most of it comes from Spain.
Most stone comes from India. The average price of the 281,500 tonnes of stone that was imported from India in the second quarter this year was £235. The average price of the 110,000tonnes of stone from China in the second quarter of this year was £311. And the average price of just under 16,000 tonnes from Italy was £897.
The figures are not exactly comparable because the products are not exactly the same. For example, quite a lot of sandstone for paving comes from India and sandstone paving is not as expensive as polished granite. Also, a fair amount of the granite from China is setts and kerbs, which are less expensive than polished slabs, while Italy sends a lot of added-value finished stone to the UK. Nevertheless, the trends are clear.
Source: Stone specialist